
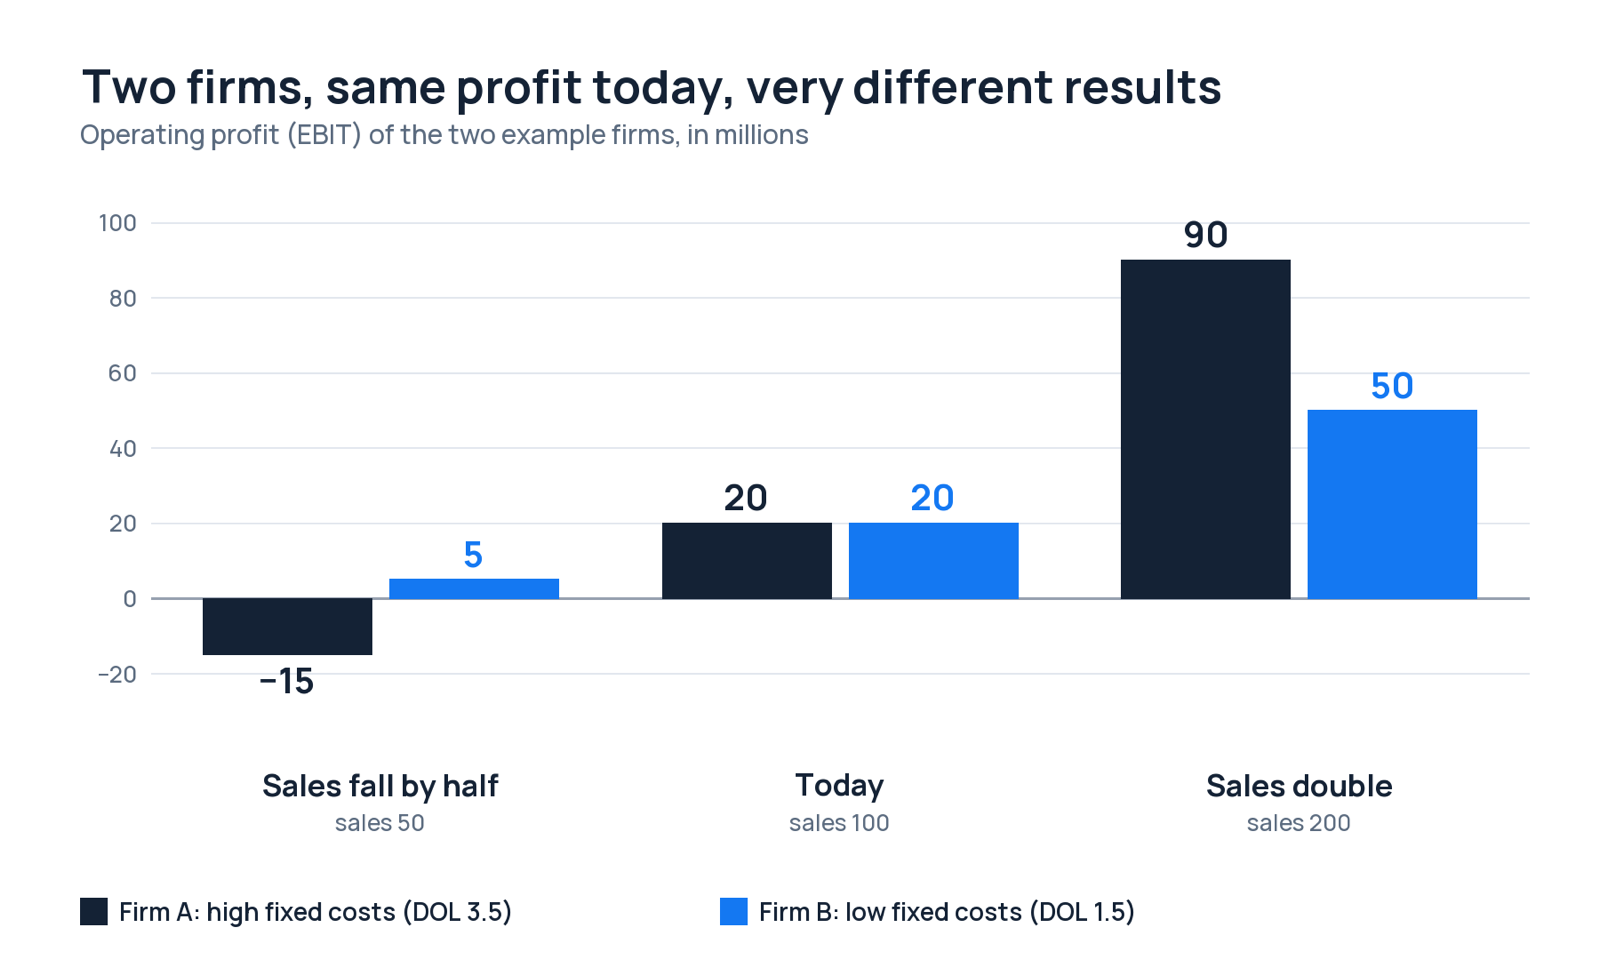
- In short: operating leverage shows how strongly a company's operating profit reacts when sales go up or down.
- The more of your costs are fixed, the stronger the reaction, in both directions.
- You can manage it: know your own numbers, make costs more flexible where it makes sense, and keep a plan for weak periods.
Operating leverage is one of the reasons why some companies see their profit grow much faster than their sales, and why others slip into a loss after a modest fall in sales. It describes how sharply a company's operating profit reacts to a change in revenue. Two businesses with identical revenue and identical profit today can have very different futures: after the same percentage rise in sales, one firm's profit may rise only a little, while the other's rises by much more. The difference lies in how each has arranged its costs.
What is operating leverage?
Operating leverage is the extent to which a business uses fixed operating costs in its cost structure. Every business has two broad kinds of operating cost:
- Fixed costs stay the same within a relevant range of activity: rent, salaried staff, depreciation on plant and machinery, insurance, software licences.
- Variable costs rise and fall in proportion to output: raw materials, direct labour paid per unit, packaging, sales commissions, freight.
Once fixed costs are covered, each additional unit of sales adds its full contribution margin (selling price less variable cost) to operating profit.
Example
Consider two firms that each sell 100 million a year and each earn 20 million of operating profit (EBIT, earnings before interest and tax). Firm A runs an automated plant with high fixed costs. Firm B outsources production and pays mostly per unit.
| Millions | Firm A (high fixed costs) | Firm B (low fixed costs) |
|---|---|---|
| Sales | 100 | 100 |
| Variable costs | 30 | 70 |
| Contribution | 70 | 30 |
| Fixed costs | 50 | 10 |
| EBIT | 20 | 20 |
| Contribution margin ratio (contribution ÷ sales, also called the P/V ratio) | 70 ÷ 100 = 0.70 | 30 ÷ 100 = 0.30 |
| Break-even sales (fixed costs ÷ contribution margin ratio) | 50 ÷ 0.70 = 71.4 | 10 ÷ 0.30 = 33.3 |
Illustrative example with fictional figures.
Firm A must reach sales of 71.4 million just to break even. Firm B breaks even at 33.3 million, less than half of that.
What happens when sales fall?
Suppose the sales of both firms fall by half.
| Millions | Firm A | Firm B |
|---|---|---|
| Sales | 50 | 50 |
| Variable costs | 15 | 35 |
| Contribution | 35 | 15 |
| Fixed costs | 50 | 10 |
| EBIT | −15 | 5 |
Firm A falls into an operating loss, while Firm B stays profitable.
What happens when sales double?
| Millions | Firm A | Firm B |
|---|---|---|
| Sales | 200 | 200 |
| Variable costs | 60 | 140 |
| Contribution | 140 | 60 |
| Fixed costs | 50 | 10 |
| EBIT | 90 | 50 |
Firm A's operating profit rises far more than Firm B's. High fixed costs can be painful when sales are low and lead to very high profits when sales are high.
Degree of operating leverage
The degree of operating leverage (DOL) measures how many times operating profit moves for a given percentage change in sales: DOL = % change in EBIT ÷ % change in sales.
| When sales fall | Firm A | Firm B |
|---|---|---|
| Change in sales | 100 → 50 (−50%) | 100 → 50 (−50%) |
| Change in EBIT | 20 → −15 (−175%) | 20 → 5 (−75%) |
| DOL | −175 ÷ −50 = 3.5 | −75 ÷ −50 = 1.5 |
| When sales double | Firm A | Firm B |
|---|---|---|
| Change in sales | 100 → 200 (+100%) | 100 → 200 (+100%) |
| Change in EBIT | 20 → 90 (+350%) | 20 → 50 (+150%) |
| DOL | 350 ÷ 100 = 3.5 | 150 ÷ 100 = 1.5 |
The lever works equally hard in both directions. With every 1% change in sales, up or down, EBIT moves by 3.5% for Firm A and by 1.5% for Firm B. (A quick way to calculate it: DOL = contribution ÷ EBIT, which is 70 ÷ 20 = 3.5 for Firm A and 30 ÷ 20 = 1.5 for Firm B.)
What can a business owner do?
As a business owner you can:
- Understand the degree of operating leverage of your own business.
- Understand how your sales have moved in the past and what to expect in the coming months and years.
- Based on the first two, consider whether you can:
- turn part of your fixed costs into variable costs, or the other way round;
- agree flexible contracts;
- build a cash cushion to get through a period of falling sales;
- match financial leverage to operating leverage: if your DOL is high, keep debt low;
- track your break-even point and margin of safety every month;
- improve your contribution margin through better purchasing, less waste or a richer product mix;
- make fixed assets earn more through extra shifts, off-peak pricing, job work or renting out idle capacity, spreading the same fixed cost over more sales;
- add capacity in stages tied to proven demand rather than in one large jump;
- diversify revenue across customers, products or markets with different cycles;
- secure steadier revenue through annual contracts, subscriptions, retainers or minimum-order agreements;
- keep a downturn plan ready: decide in advance which costs to cut, defer or convert if sales fall by 10%, 20% or 30%, and arrange a working-capital line before you need it;
- use pricing carefully: discount to fill unused capacity, not as a standing strategy that erodes margins.
Operating leverage and business decisions
Operating leverage is not just a ratio to calculate. It sits behind several of the most important choices a management team makes.
- Cost structure and automation. Replacing labour with machines, or outsourced production with an owned plant, turns variable costs into fixed costs. The business gains higher margins at volume but takes on more risk if volume disappoints. The decision should rest on how confident management is about sustained demand.
- Break-even and capacity planning. High fixed costs push the break-even point up. A new factory, store or kitchen must reach a meaningful level of use before it earns anything, so capacity additions need realistic volume forecasts and a cushion for a slow ramp-up.
- Pricing. Businesses with low variable costs per unit make a profit on almost any price above variable cost. This is one reason why businesses with a high share of fixed costs, such as airlines or software companies, are often willing to discount to fill unused capacity.
- Growth and scalability. Operating leverage is what makes a business scalable. Once fixed costs are covered, additional revenue largely drops through to profit. Businesses that can grow revenue without growing costs at the same pace are often valued more highly.
- Financing. A business that already carries high operating risk should usually be cautious about adding high financial leverage on top.
Risks
- Business risk. High operating leverage raises business risk. In a recession, a firm with high operating leverage can slip from a healthy profit into a loss on a modest fall in volume, and its fixed costs keep draining cash.
- Combined leverage. Operating leverage magnifies the effect of sales on EBIT. Financial leverage then magnifies the effect of EBIT on earnings per share through fixed interest costs. High operating leverage together with high financial leverage can therefore mean very high business risk. Sound financial management usually pairs high operating leverage with low debt, and the other way round.
If you want an independent look at how your costs are structured, our Business Cost Optimization Analysis looks at your largest cost areas and gives you written findings and recommended next steps.
This article is general business and financial guidance and does not constitute regulated tax or legal advice.