
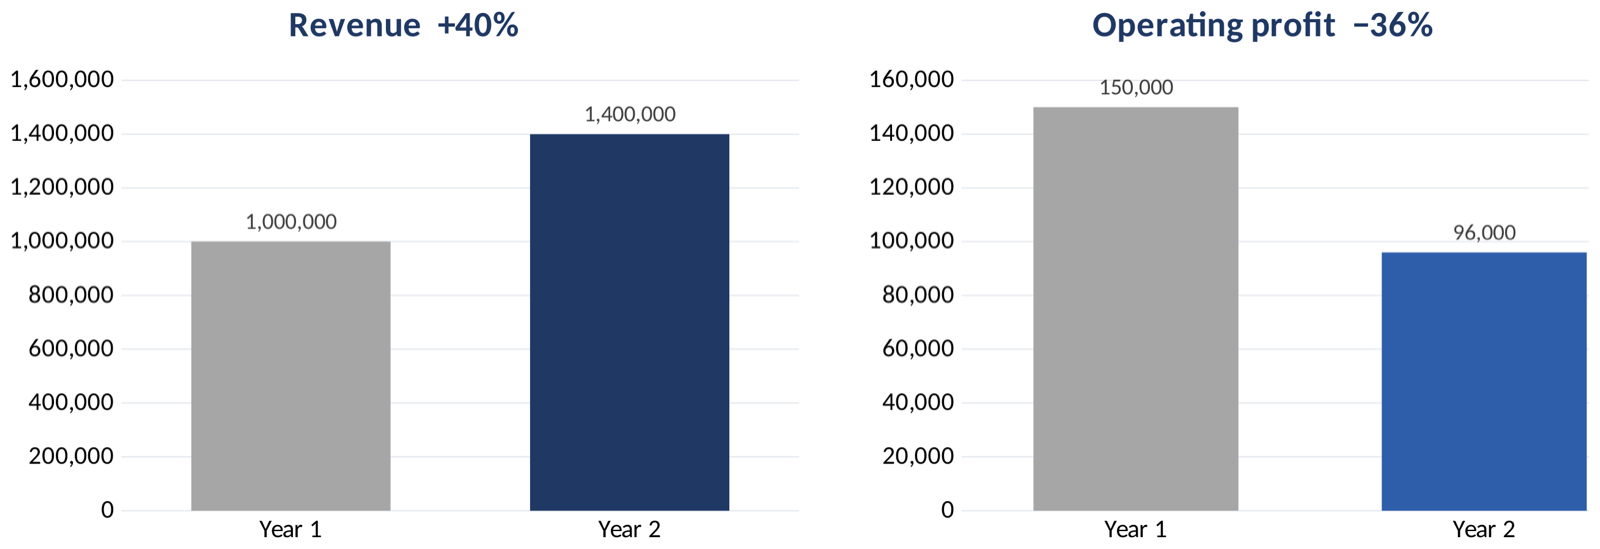
Picture a distribution business. In two years it added a sales channel, hired two people, and celebrated the growth. At the year-end review, the profit line was smaller than the year before.
Nothing had gone wrong in the usual sense: it grew in a direction that carried a lower margin, and nobody was reading that line.
Revenue is vanity, margin is sanity. It is an old line, and it survives because it is right: revenue measures activity; margin measures what remains.
What your profit and loss statement is telling you
A profit and loss statement can run to thirty lines. Three are enough.
- Revenue is what you billed, net of VAT, refunds and credits. Discounts are already inside it.
- Gross profit is revenue minus cost of goods sold: stock or materials, inbound freight, packaging, platform and payment fees on that sale, and the cost of handling returns.
- Operating profit is gross profit minus operating expenses: payroll, rent, software, marketing, professional fees, admin.
The boundary owners blur is COGS versus overhead. One test settles it: a cost you would not have incurred if that sale had not happened belongs in COGS; anything that arrives whether or not you sell belongs in overhead. For management reporting, move freight and payment fees into COGS and the margin becomes honest.
Why a margin falls while everything looks fine
Gross margin moves for a handful of reasons, most inside your control:
- Price. Discounts, promotions and price matching. A 10% discount on a product with a 30% margin removes a third of its gross profit.
- Mix. A cheaper product line or a lower-margin channel grows faster than the rest.
- Input costs. Supplier prices, freight, duties and fees rise, and your selling price does not follow.
- Returns and refunds. The refund reverses revenue and the related cost together. What is left is the cost of handling the return — return freight, restocking, write-offs — and that belongs in COGS.
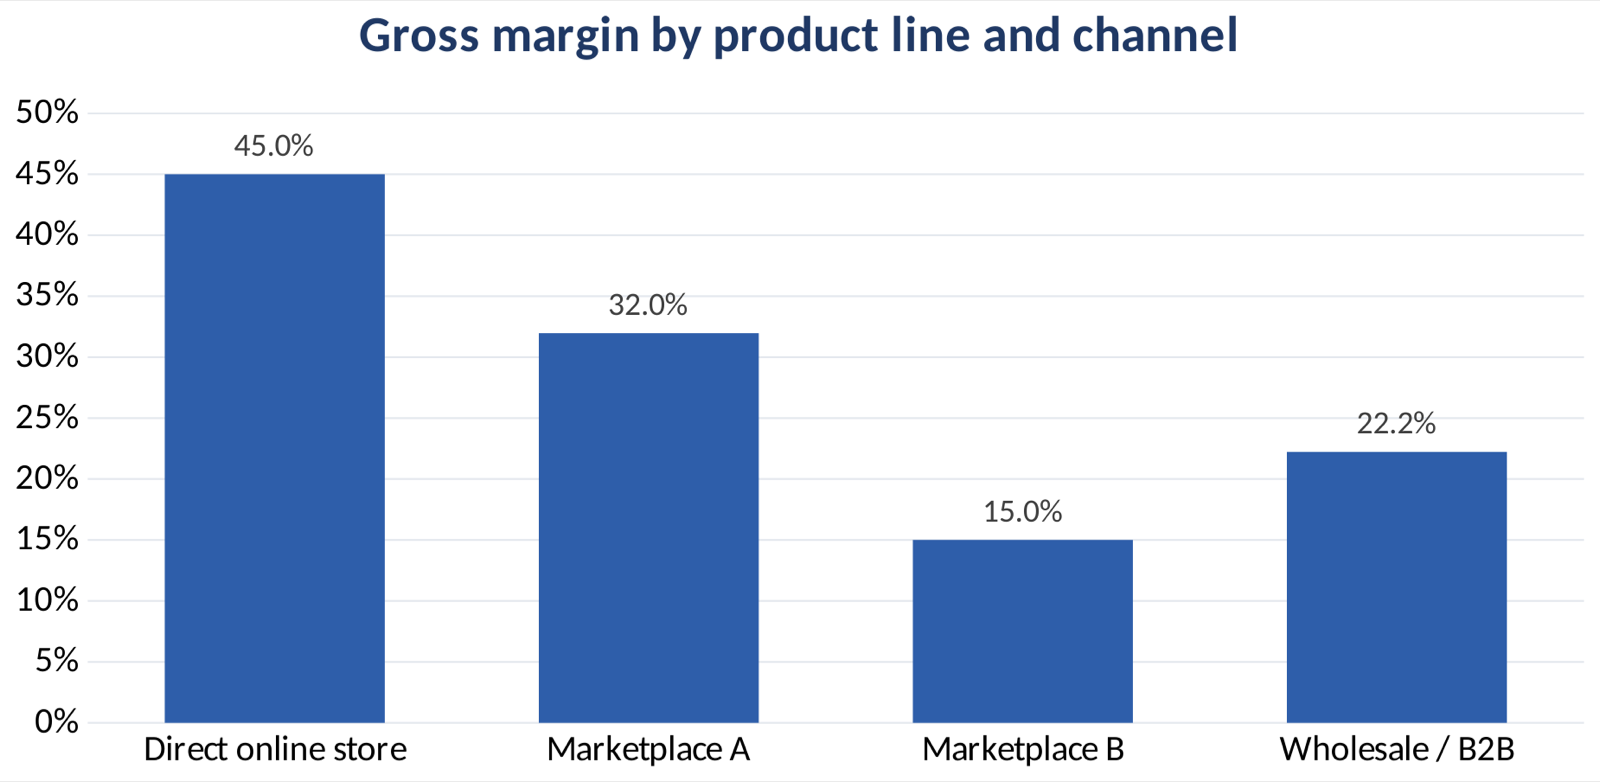
- Channel. Marketplaces charge commission, direct sales do not, and the two rarely share the same margin.
- Currency. If you buy and sell in different currencies, the rate moves your cost base.
None announce themselves. Each moves the average a little, and small moves repeated for two years turn a healthy business into a high-revenue, low-profit one.
Revenue up 40%, profit down 36%
A common pattern, with rounded figures: a company sells 1.0m in year one and 1.4m in year two.
| Metric | Year 1 | Year 2 | Change |
|---|---|---|---|
| Revenue | 1,000,000 | 1,400,000 | +40% |
| Gross margin | 45.0% | 34.0% | −11.0 pts |
| Gross profit | 450,000 | 476,000 | +5.8% |
| Operating expenses | 300,000 (30.0% of revenue) | 380,000 (27.1%) | −2.9 pts |
| Operating profit | 150,000 (15.0%) | 96,000 (6.9%) | −36% |
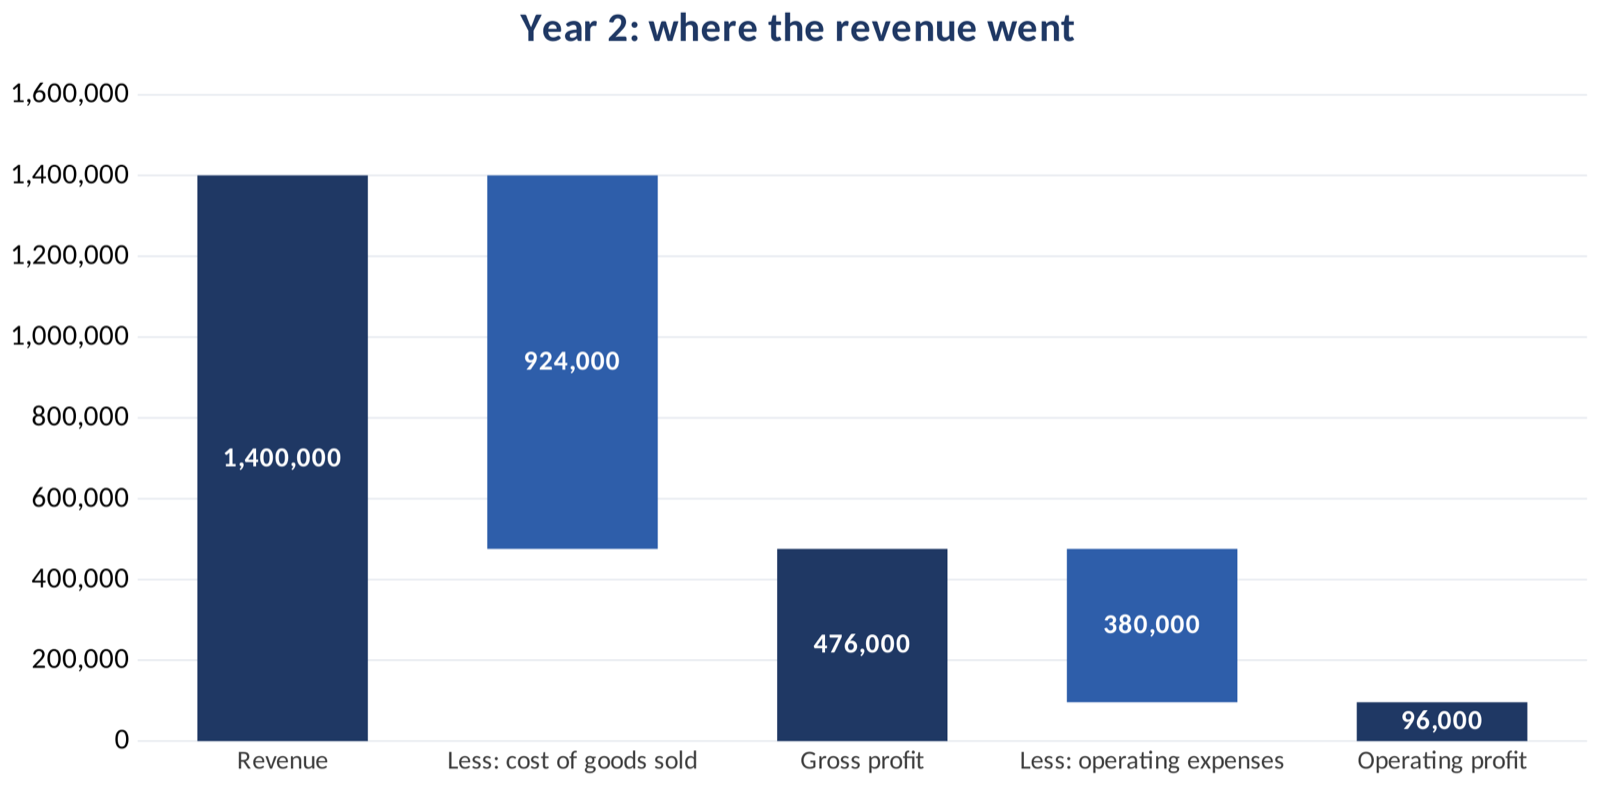
Revenue grew 40%. Gross profit grew 5.8%, because the margin fell eleven points. Operating expenses fell as a share of revenue, from 30.0% to 27.1%. Operating profit fell 36%.
The owner’s first instinct was to cut costs. But costs were already falling as a share of revenue, and cutting further would have cost capacity the new revenue needed.
There are only two ways back to 150,000 of operating profit. Grow revenue another 11%, to about 1.56m, at the current margin and with operating expenses unchanged. Or restore the margin to 37.9% on today’s revenue. Three point nine points of margin is worth roughly eleven percent more revenue, and it is usually cheaper: no new customers, no new stock, no new people.
Three numbers, once a month
Three numbers, on the same day each month.
- Gross margin as a percentage. Revenue minus COGS, divided by revenue.
- Gross profit per order, or per unit sold. The average can hide a lot; the per-unit figure shows whether a specific product or channel is carrying its weight.
- Operating expenses as a percentage of revenue. This tells you whether overhead is growing faster than the business.
A few minutes a month. Otherwise you find out a year later, after decisions are made.
A monthly rolling forecast is the natural home for these three numbers: as we set out in the earlier article on rolling forecasts, it puts margin and cash next to revenue.
Where the leak is: four questions
When margin falls, work through four questions in order.
- Price. Did the average selling price fall? Look at discounts and promotions as a percentage of gross sales, not as an occasional event.
- Mix. Did the share of low-margin products or channels grow? Compare the mix with the same month last year, not with last month.
- Unit cost. Did supplier prices, freight or fees rise faster than your selling price? A supplier increase is a margin event even when the invoice looks normal.
- Volume. Are fixed costs now spread over less activity than you assumed? This is the only one where growth genuinely solves the problem.
Each answer points to a different fix: cutting marketing will not fix mix; raising prices will not fix cost. Most try the wrong one first because the diagnosis was skipped.
What to do about it
- Set a margin floor per product and channel, and approve discounts against it. This can start in the current month, with no new data.
- Renegotiate or re-source your three largest input costs. They usually sit with a few suppliers; volume is the argument, and the exercise typically takes a month or two.
- Review the products or channels with the lowest gross profit. The revenue they add is real; the profit they remove is real too, and is usually the part nobody measures. One full round a quarter is usually enough.
- Report margin monthly, with revenue, starting next month. Reviewed once a year, with the annual accounts, it is a post-mortem, not a control.
One warning: do not answer a margin problem with an overhead cut. It is quick and visible, but it does not touch the leaking line, and it removes capacity you need next quarter.
Five warning signs
- Revenue is growing; the bank balance is not.
- Discounts are approved by sales without a margin check.
- A new channel has no separate profit and loss.
- Gross margin is reviewed once a year, with the annual accounts.
- Someone says the margin will recover on volume.
If growth is outpacing profit
If revenue is growing faster than profit, an independent read is worth more than another month of reporting: which products and channels make money, where the cost base has drifted, and what the next twelve months hold.
Here is an illustration of what such a read can find, with fictional figures. A distributor grows for two years and margin slips from 45% to 34%, while the owner cuts overhead. Move payment fees and inbound freight into COGS, split the P&L by channel, and the leak sits in one low-margin channel where discounts were approved without a margin check. Nothing was hidden; nobody had regrouped the numbers.
If part of the leak sits on the cost side, our Business Cost Optimization Analysis looks at your largest cost areas and gives you written findings and recommended next steps.
The fastest way to grow profit is not always to grow revenue. Usually it is to stop paying for growth with margin you cannot get back.
This article is general business and financial guidance and does not constitute regulated tax or legal advice.